Examples
Here you can learn how to use the trajalign.
To learn how to use the trajectory class go to the trajectory class example.
To learn how to average trajectories belonging to the same experiment together go to the average trajectories example. Through this example you will be able to produce this plot:

The inward movement of the endocytic coat protein Sla1 during endocytosis. 67 independent trajectories are aligned in space and time and averaged together, with trajalign module distribution.
To learn how to align the average trajectories together go to the align average trajectories example. Through this example you will align the average trajectories of the endocytic proteins Sla1, Abp1 and Rvs167 in this plot:
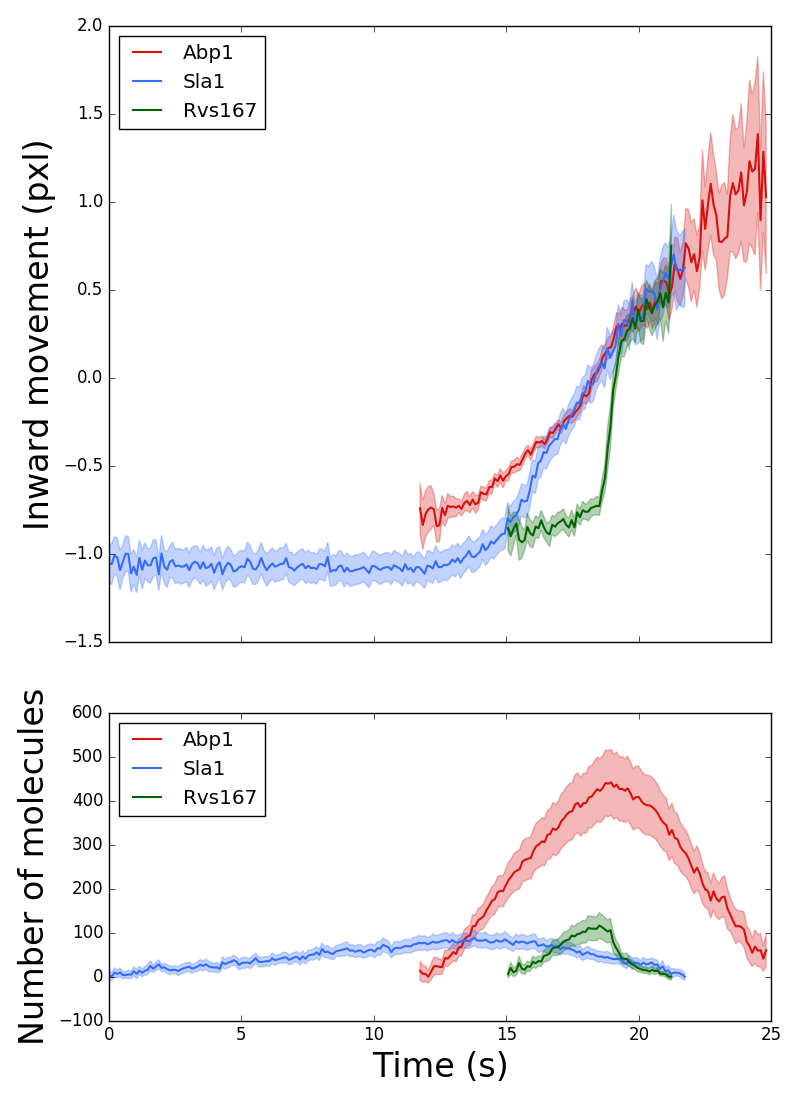

The inward movement and the fluorescence intensity profile of the endocytic coat protein Sla1, the N-BAR protein Rvs167, and the actin-binding protein Abp1.